
Taking it further
This page will be updated regularly with advice for advanced players who want to deepen their thinking and gain additional EV.
📊Blind Levels
Most charts are grouped in 2-blind increments (14–16, 12–14, 10–12, etc.). To build them, we always started from the middle level.
For example, the 14–16 bb chart is based on a study at 15 bb.
What if you have 14 bb?
Should you look at the 14–16 chart or the 12–14 chart?
In reality, it doesn't matter. If one chart shows a limp and the other shows a shove, it means the hand lies in a close EV zone: both limp and shove will yield very similar results.
The EV difference will therefore be marginal. You can make your choice depending on your opponent and your knowledge of how the hand evolves as the stack decreases. But don't overthink it — this won't affect your CEV.
📈What CEV Can You Expect When Using Our Charts?
First of all, it's essential to remember that CEV is highly subject to variance.
Even after 10,000 Spin & Go games, you can still observe a fluctuation of up to ±7–10 CEV points, purely due to randomness.
Over smaller samples — between 1,000 and 3,000 games — these fluctuations are even greater: a ±20-point variation, either up or down, is completely normal.
If the impact of variance on your CEV isn't clear to you, we strongly recommend reading the dedicated chapter on this topic in our free Spin & Go course.
It's entirely possible that your CEV decreases in the short or medium term after you start using our Charts.
Only after a large sample size (more than 5,000 games) will you be able to clearly see their long-term impact.
Also keep in mind that factors other than variance can influence your CEV.
Here are three of them:
🧠 Opponent Level
The tougher your opposition — for example, if you play at times with many regulars — the harder it will be to achieve an excellent CEV.
😴 Mental and Physical State
Your fatigue, focus, and emotional state can also prevent you from playing your A-game.
⚙️ Bad Habits
Certain bad habits can creep in unnoticed: playing too tight, calling too often in some spots, and so on.
Also note that if you already had a very good CEV and/or were already using serious ranges, it's unrealistic to expect a dramatic increase just by purchasing our Charts.
At that level, progress usually means gaining a few additional CEV points — and that's perfectly normal.
Finally, it's important to remember that a Chart is not set in stone.
If you feel more comfortable playing certain hands differently, don't hesitate to adjust your decisions slightly.
This won't significantly change your CEV, but it can improve your playing comfort and confidence, which are just as important in the long run.
For example: If you don't yet feel confident playing a hand as an ISO Non All-in because your postflop skills aren't fully developed, and the EV between ISO Non All-in and ISO shove is close — there's nothing wrong with choosing the ISO shove instead.
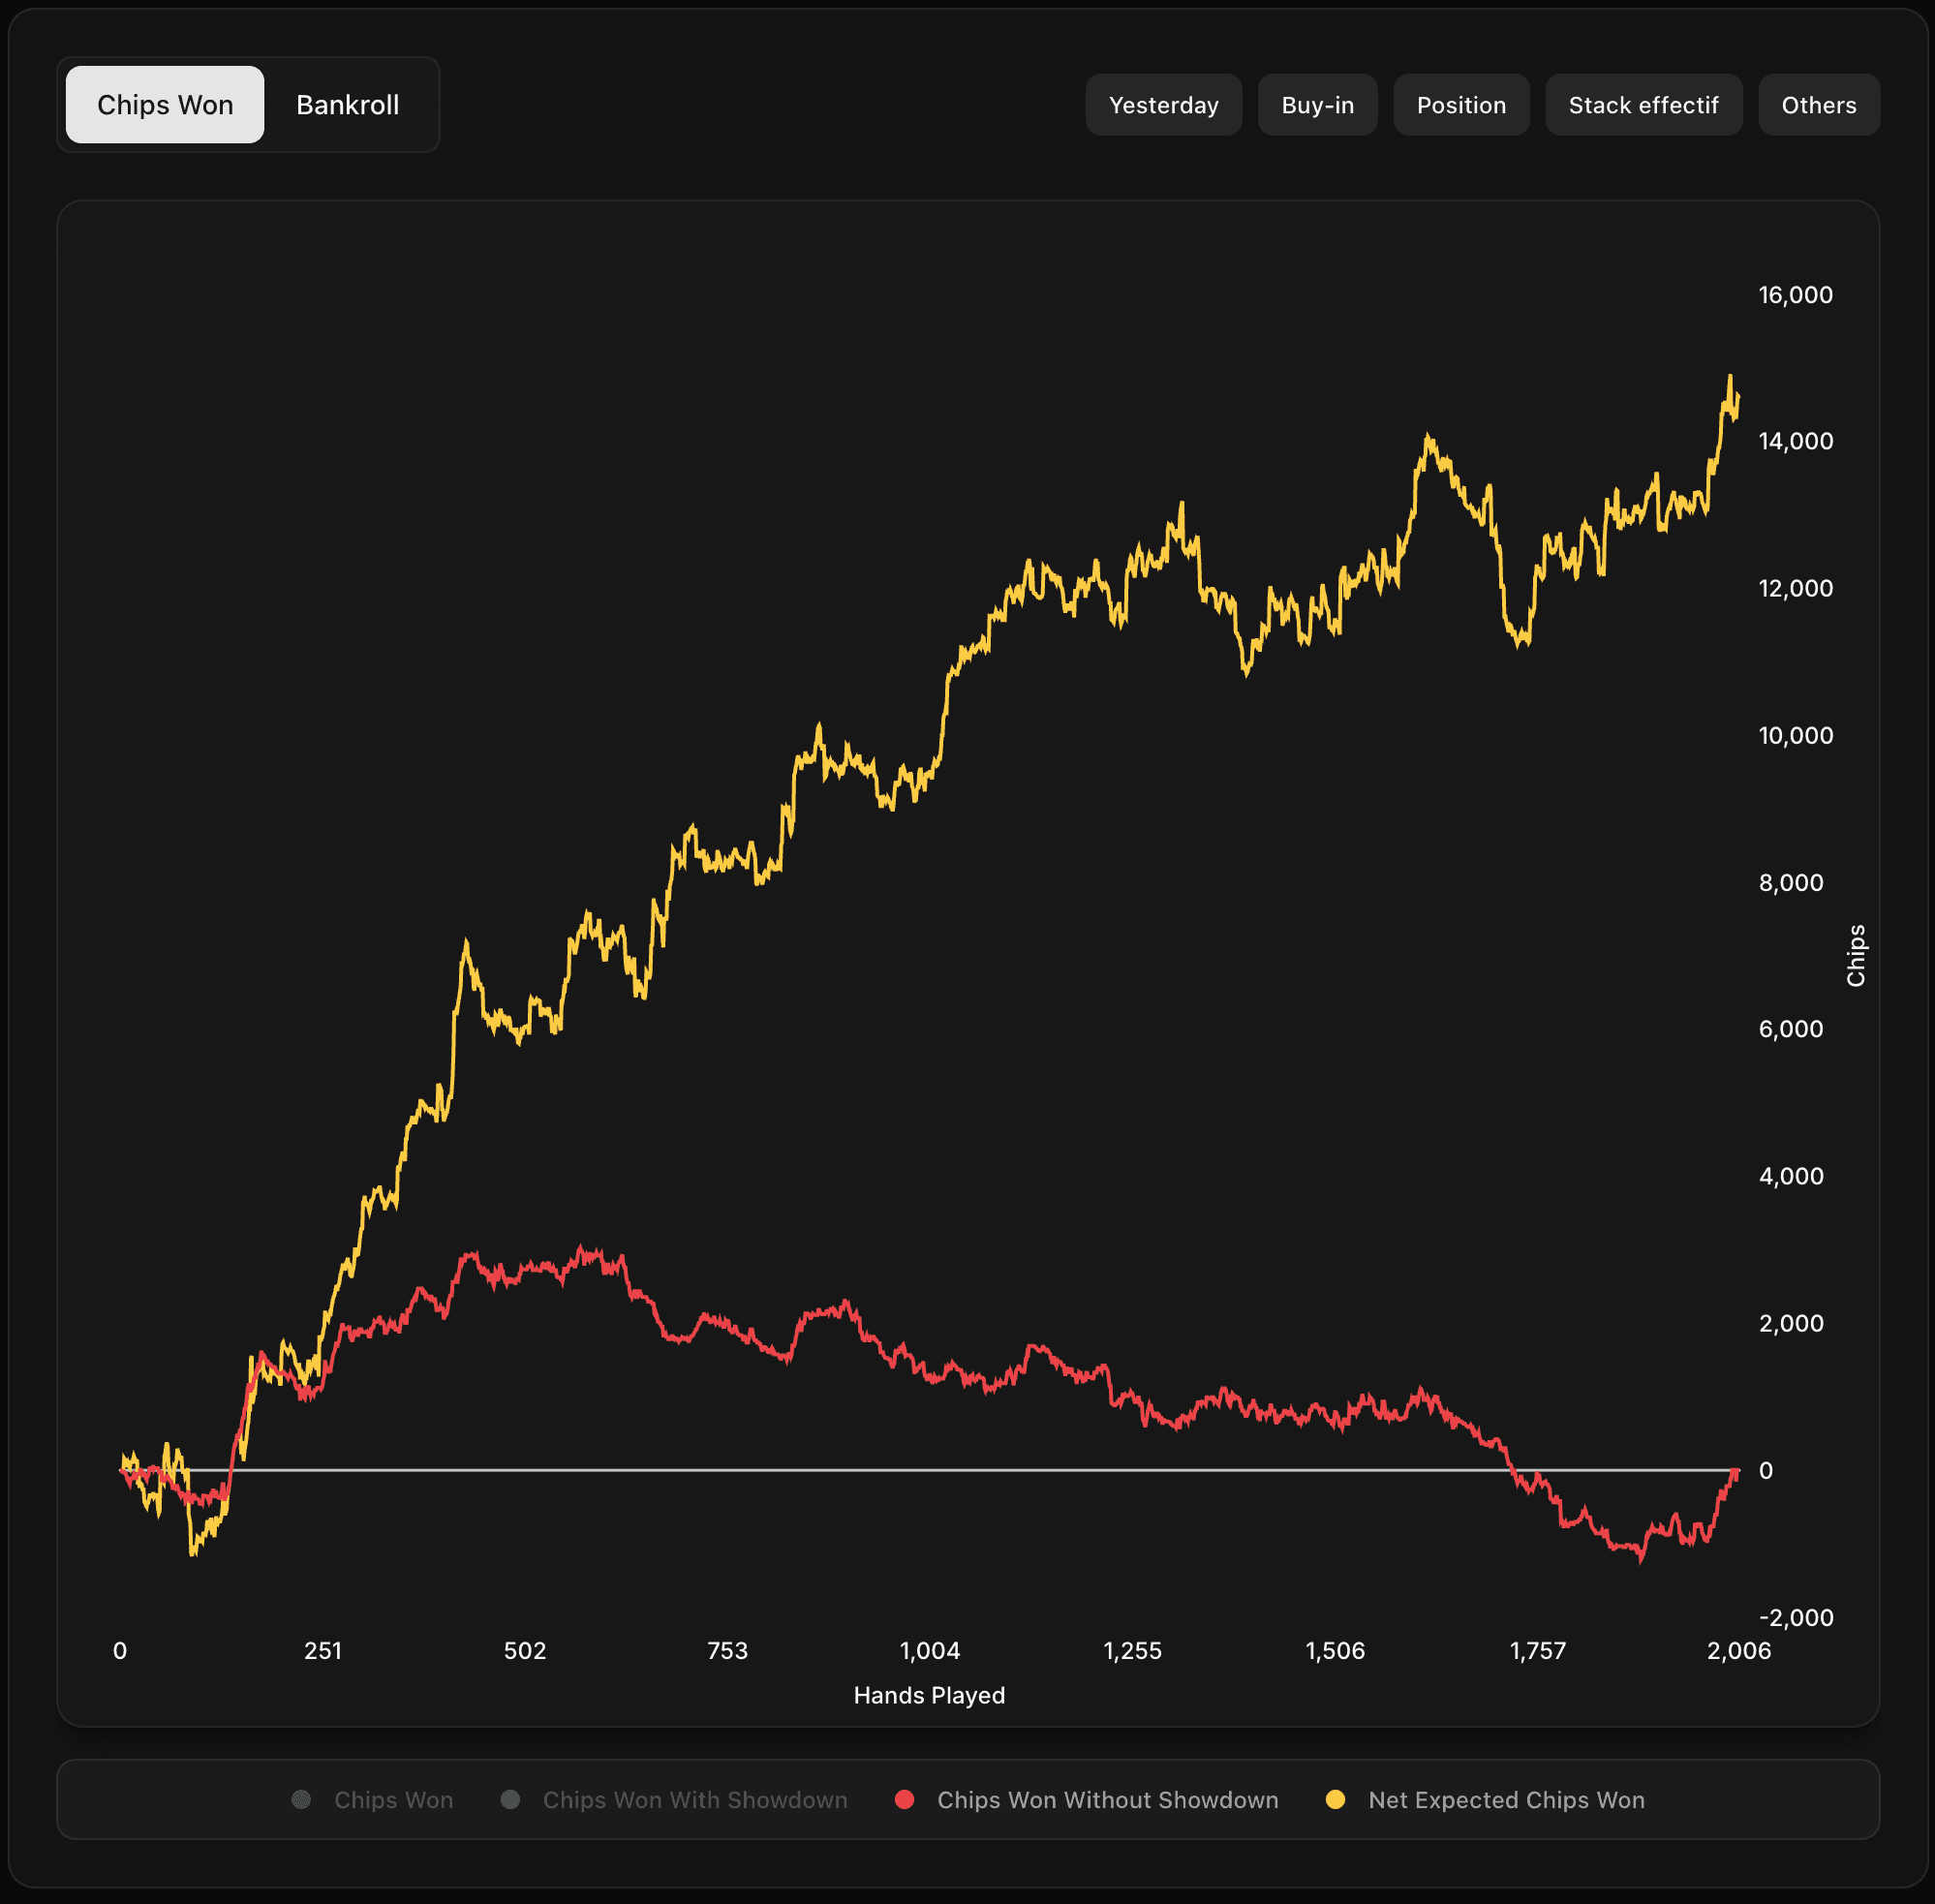
🤔What is a good Red Line?
The Red Line (non-showdown winnings) is a stat you'll find in most trackers, and many coaches tend to overestimate its importance.
I'd even say that focusing on your Red Line can be harmful to your performance.
You can have a declining Red Line and still an excellent CEV.
Conversely, a rising Red Line doesn't necessarily mean your play is solid.
Focusing too much on it can distort your decision-making: trying too hard to "win without showdown," over-bluffing, over-defending, forcing ISO-raises or c-bets out of context — and ultimately losing CEV.
🔵 The only thing the Red Line can really indicate is how your playing style distributes your winnings between Pots won without showdown (Red Line), and Pots won at showdown (Blue Line).
Our Charts are designed to be Low Variance, meaning they include fewer "borderline" open shoves and more controlled, lower-risk preflop options when EVs are close.
This naturally leads to more winnings at showdown, which might make your Red Line drop — but that does not mean your EV is decreasing.
Your EV simply shifts toward showdown winnings.
🎲Interpreting GTO Mixes
In GTO ranges, you'll often see that the same hand can be played in multiple ways because there are two colors in the same cell.
Note: what follows only applies to GTO ranges (vs Reg). For Exploit ranges (vs Fish), two colors simply mean the hand can be played in two different ways without any issue.
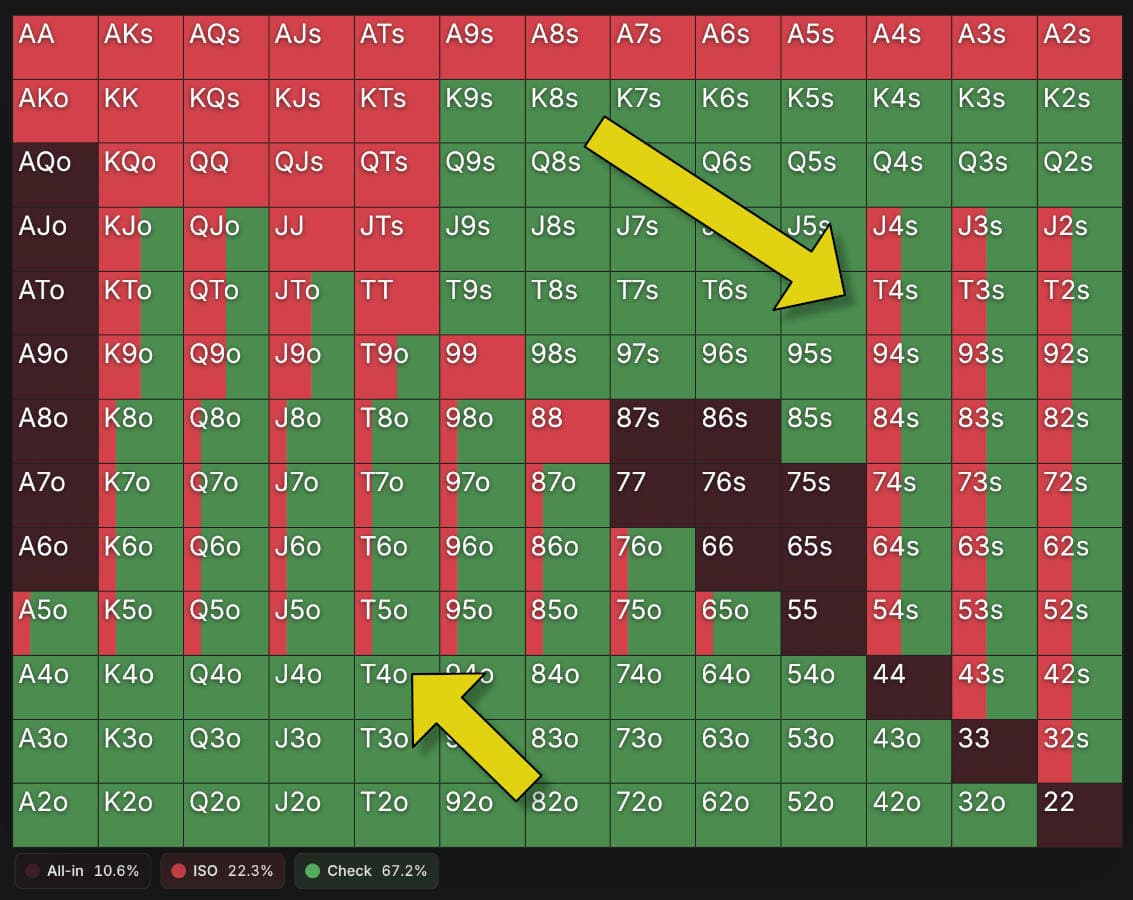
For example above, some hands can be played 50% of the time as an iso and 50% of the time as a check.
In theory, this means that to be perfectly balanced, you should alternate exactly one time out of two between both actions. The goal is to be unpredictable and make your range impossible to exploit.
But in practice, nobody can follow perfect frequencies. It's simply not humanly possible to play at the "exact percentage" in real time.
The right way to interpret these mixes
➡️ When two actions appear in a cell of a GTO range, it means you should do a bit of both.
➡️ Your goal isn't mathematical precision, but a coherent and reasonable frequency.
In practice
If an action is mixed at 50%, you can interpret it as "roughly one time out of two."
If an action only appears at 10%, it simply means you should do it rarely, without trying to measure exactly 1 out of 10 times.
The idea isn't to be perfectly balanced down to the exact percentage but to avoid always choosing the same action.